
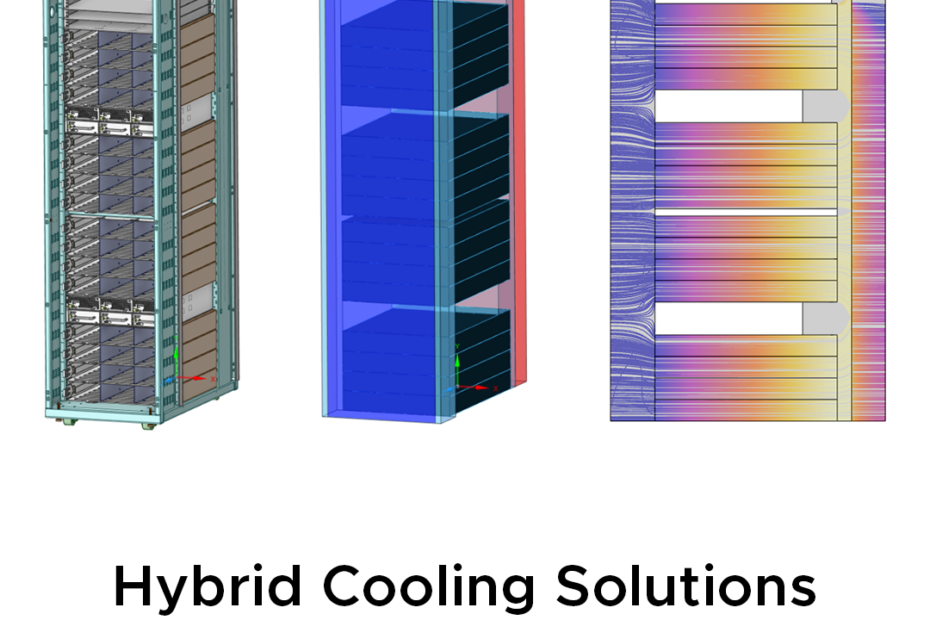
Over recent years, the world has witnessed a rapid development of artificial intelligence (AI) technology. AI has evolved tremendously from just answering basic questions to helping experts solve specialised problems such as diagnostic imaging or software development. At the core of this rapid advancement, GPU infrastructures play a critical role in enabling massively parallel computing power for AI tools to complete more complex tasks under shorter timeframes. Moreover, GPU infrastructures can help engineers leverage modern CFD software such as Ansys Fluent’s GPU solver to significantly shorten the waiting time for a simulation analysis, allowing more runs to be completed and faster feedback to help make rapid engineering decisions.
Whilst the buildout of brand-new GPU-native data centres continues, the demand for GPU computing means that owners and operators are increasingly looking to retrofit GPU hardware into existing data centre halls that were originally designed to handle heat loads from CPU-based server equipment. However, adopting new GPU hardware into air-cooled infrastructures designed for conventional CPU clusters can easily overstress the existing HVAC systems, as a GPU server rack generally produces a heat load of at least 3 times higher than the heat load from a CPU server rack (for same spatial footprint). To tackle this challenge, let’s explore the simulation of a hybrid cooling solution such as the Rear Door Heat Exchanger (RDHx) which is commonly proposed as an option to provide additional cooling capacity to an existing air-cooled data centre [1].
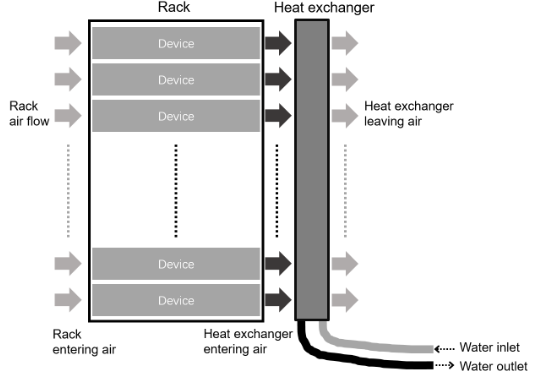
Figure 1 Schematic of a RDHx hybrid cooling system
[https://pubs.lenovo.com/hdc_rackcabinet/options_48u_heat_exchange_door]
In this blog, the effectiveness of the RDHx hybrid cooling solution is investigated through a CFD case study where an existing air-cooled data centre is required to adapt to a higher thermal capacity when partially transitioning from CPU hardware to GPU hardware. Through this case study, LEAP Australia is showcasing how engineers can leverage on Ansys Fluent’s CFD simulations to help determine whether a hybrid cooling solution such as the RDHx is a viable option.
State of Play: Existing Air-cooled System
In this scenario, we are looking at an existing data centre designed to support the Open Rack V2 (ORV2) racks from Meta’s Open Compute Project (OCP) [2], as shown in Figure 2. The ORV2 rack provides 42U of mountable space. This space is split into 16 internal rows of 2U height to mount the primary computing components, while the rest of the space is reserved for various power distribution units (PDUs) and power supply units (PSUs).
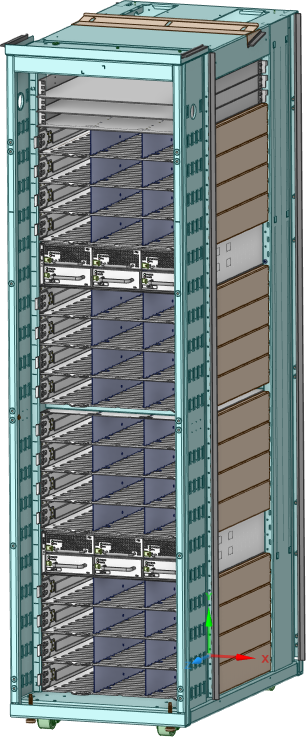
Figure 2 Layout of the ORV2 rack
Figure 3 and Figure 4 show the general layout of the data centre cooling system, which follows a hot aisle containment system (HACS) design. The HACS layout not only improves air-cooling efficiency by preventing the hot and cold air streams from mixing but also confines hot exhaust air inside the hot aisle so the rest of the room remains at a comfortable temperature for personnels and perimeter equipment [3]. The existing layout consists of a main room that acts as the cold air plenum, a hot aisle containing the exhaust air coming out of the back of each rack, and an exhaust ductwork to vent the hot air out of the system.
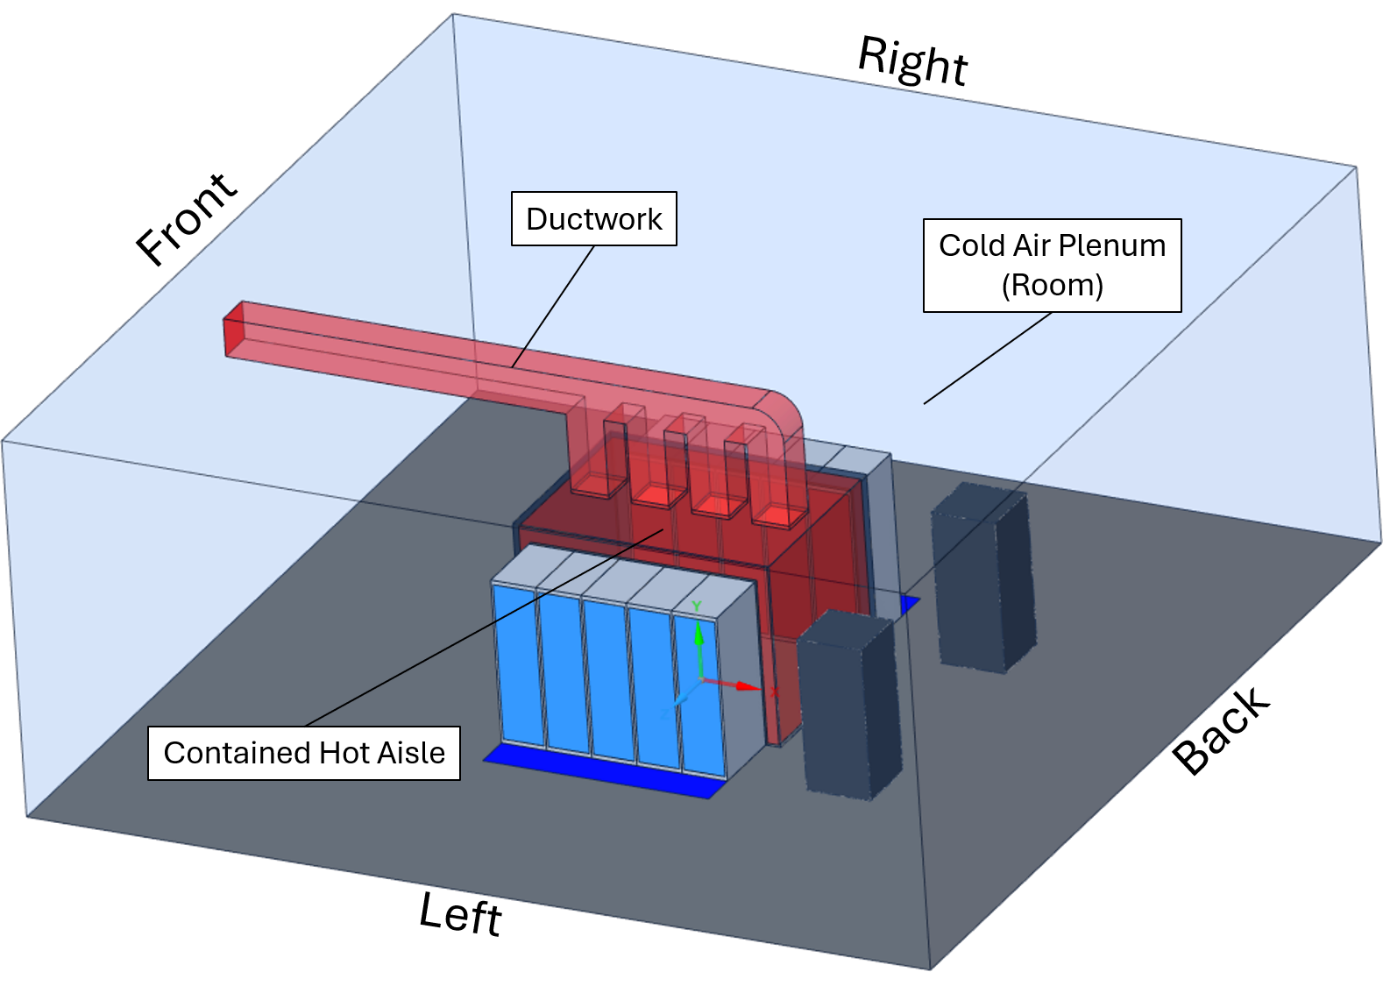
Figure 3 Main layout of the data centre
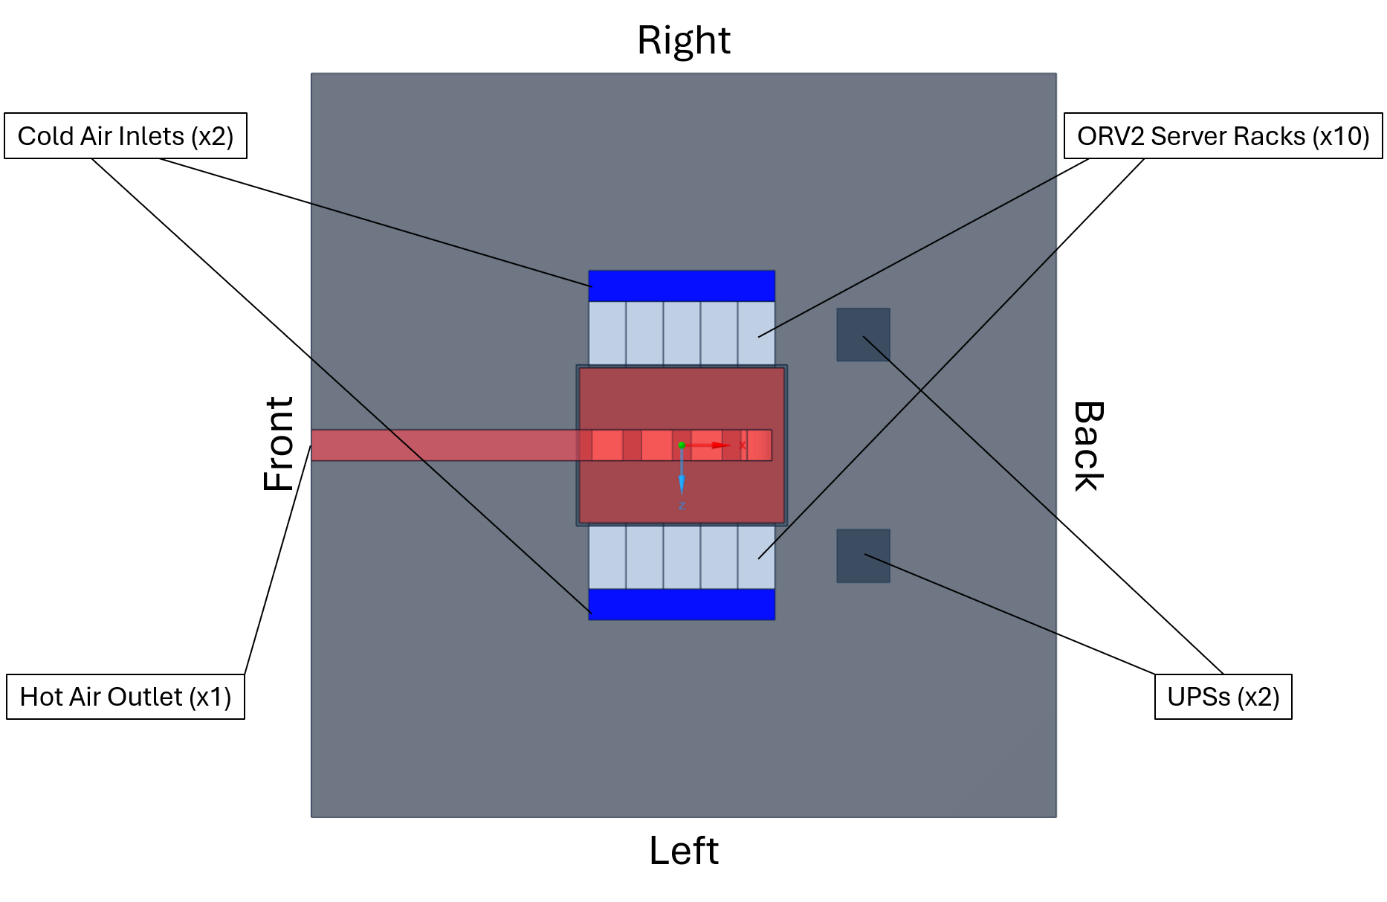
Figure 4 Air entry/exhaust pathways and the components inside the data centre
The data centre supports a total of x10 ORV2 racks split across two rows with the back facing each other to form the hot aisle. Two uninterruptable power supplies (UPSs) are included as the representative perimeter equipment. Two inlets are positioned on the floor to supply cooling air to each rack as well as to maintain the ambient temperature inside the room at 25 °C. Cool air then travels through each rack, absorbs heat then rejoin inside the hot aisle before being exhausted through a single outlet.
Increased Energy Consumption
As part of the original operation, the cooling system expects all ten racks to exert a heat load of 10 kW each, matching the previous energy trend of CPU-based data centres. However, as part of a potential plant upgrade, five of the racks on the left row (Figure 4) are to be populated with GPUs, bringing the heat load to 30 kW per rack, while the right row remains at 10 kW per rack. A custom rear door heat exchanger unit is to be considered as a potential solution to the additional heat load. Three key simulation scenarios have been conducted including:
- Scenario 1: Cooling performance of the original layout where each of the ten racks exerts a 10 kW heat load.
- Scenario 2: Cooling performance of the original layout where the heat load at each rack on the left row increases to 30 kW.
- Scenario 3: Cooling performance when the custom RDHx is mounted at the back of each rack on the left row to help remove the 30 kW heat load per rack.
Through these three CFD simulation analyses, a design engineer can gain more insight on the impact of the increased cooling load on the main air-conditioning system as well as to determine the effectiveness of the retrofitted RDHx hybrid cooling system in reducing the load on the main cooling component.
Internal Flow in each Server Rack
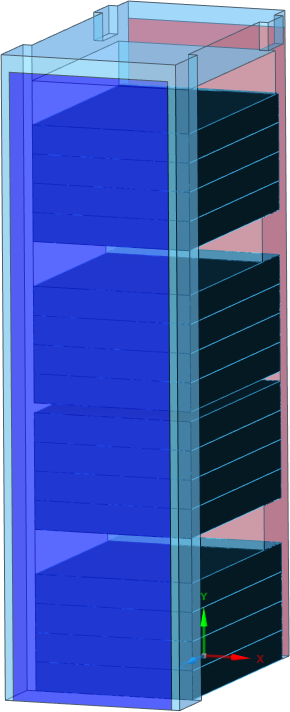
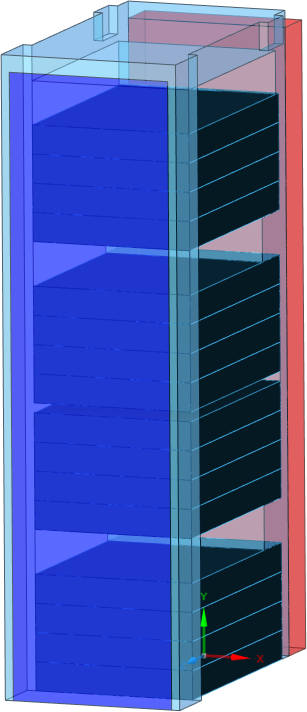
The internal flow and heat transfer of each server rack can be analysed through a series of independent CFD simulations outside the scope of the entire data centre. To facilitate the internal CFD analyses, the ORV2 geometry is then simplified into two variations without and with the RDHx mounted at the back (Figure 5). Both variations include the main air pathway as well as the individual pathways through each of the 16 internal rows. The second geometry variation includes a simplified rectangle domain to represent the added rear door heat exchanger.
(a)
(b)
Figure 5 CFD models of the internal flow of a single rack. (a) Without RDHx. (b) With RDHx.
The internal CFD analysis can be divided into three sub-scenarios to correspond to the data centre’s three operation scenarios, including:
- Sub-scenario 1: Flow and heat transfer of a rack subjected to the original 10 kW heat load without RDHx installed (Figure 5a).
- Sub-scenario 2: Flow and heat transfer of a rack subjected to the increased 30 kW heat load without RDHx installed (Figure 5a).
- Sub-scenario 3: Flow and heat transfer of a rack subjected to the increased 30 kW heat load with RDHx installed (Figure 5b).
All of the sub-scenarios have an inlet air temperature of 25 °C, matching the intended operating temperature of the cold air plenum inside the main room. The total heat loads of 10 kW and 30 kW are divided evenly between the 16 internal rows as individual heat sources. Each row is modelled as a porous medium to capture the air resistance of the internal components. A representative fan curve is applied at each medium to drive the cooling air flow through the rows.
The key difference between the third sub-scenario and the other two is the implementation of the heat exchanger domain. Here, the domain acts as a heat sink instead of heat source to remove heat from the rack before the air is returned to the hot aisle. The heat removal rate of the RDHx is calculated based on the ε-NTU method with an assumed 65% efficiency and constant water supply at 18 °C. The heat exchanger domain is also modelled as a porous medium to simulate expected pressure drop as air is pushed through. Finally, another indicative fan curve is applied at the back of the heat exchanger to help counteract the pressure drop and return the pressure to the ambient condition.
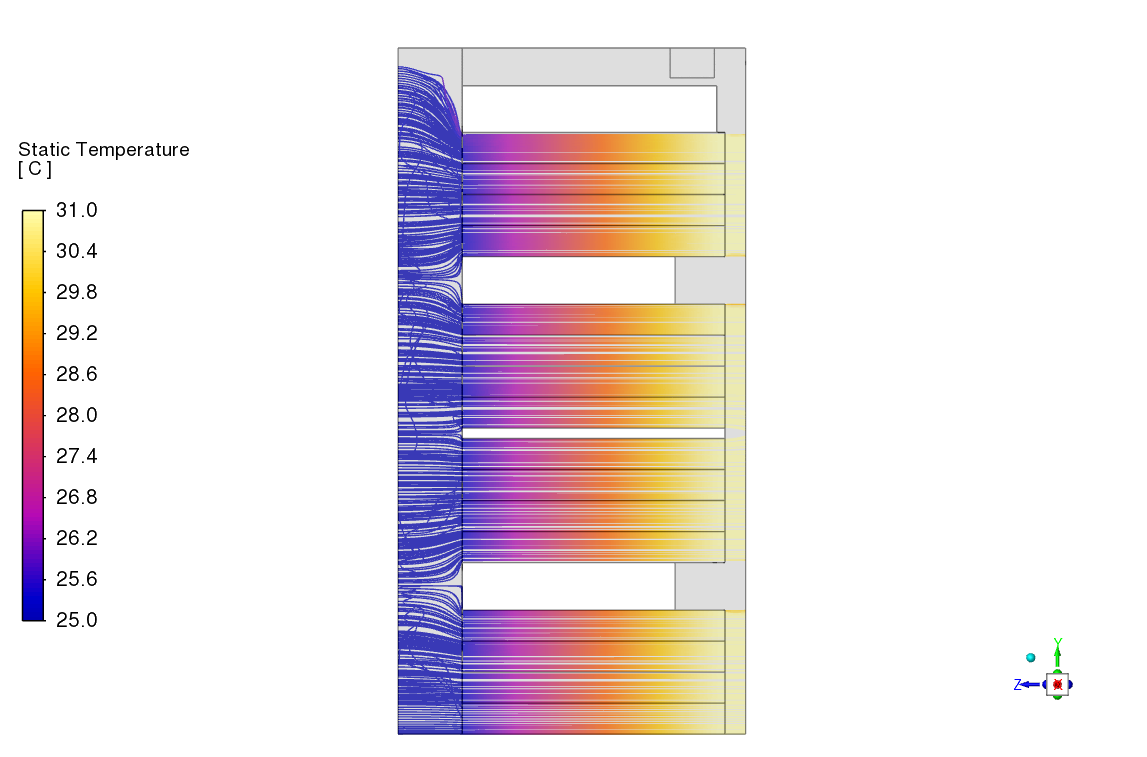
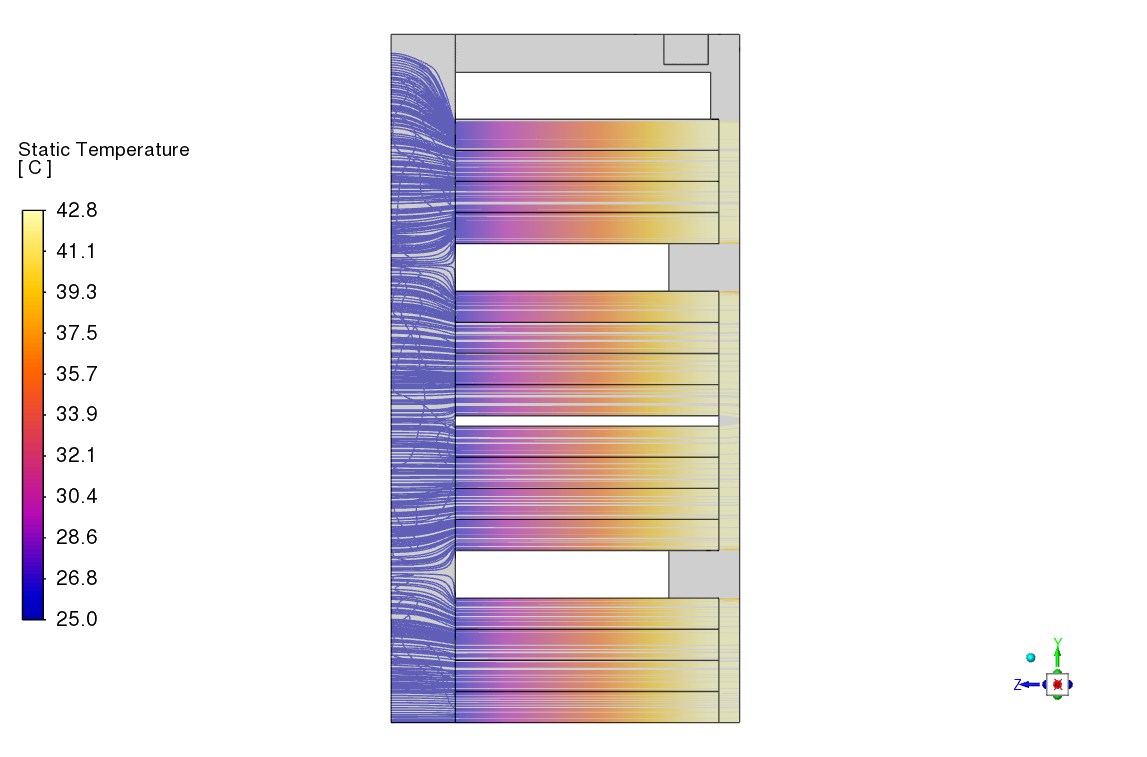
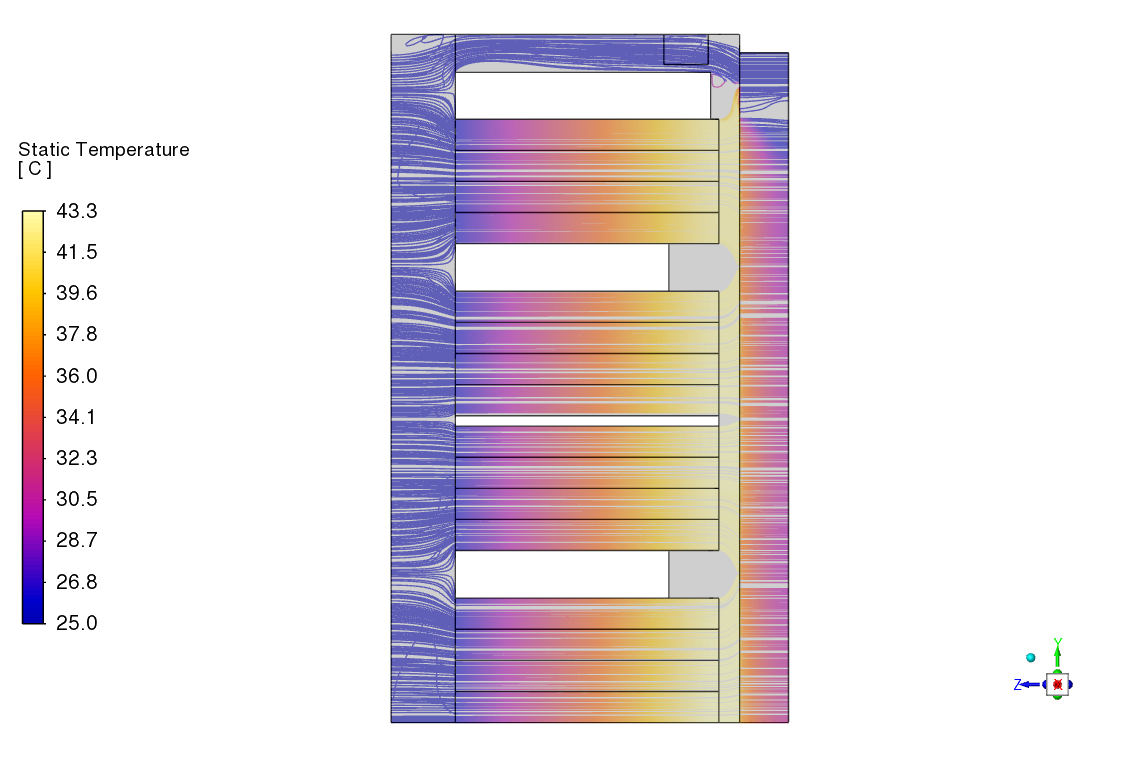
In Figure 6, temperature pathlines plots are used to compare the thermal flow fields between the three sub-scenarios. Across all three configurations, the air flow is a bit chaotic coming from the intake before being perfectly straightened out inside the 16 individual rows. A major change in the flow structure can be found at sub-scenario 3, where the addition of the heat exchanger exhaust fan creates a substantial flow bypass through the empty space on top of the electrical components. Porous properties of the RDHx block have been tuned to realistically capture the straitening effect of a typical radiator.
(a) Sub-scenario 1
(b) Sub-scenario 2
(c) Sub-scenario 3
Figure 6 Temperature pathlines through the rack at each sub-scenario.
(a) Sub-scenario 1
(b) Sub-scenario 2
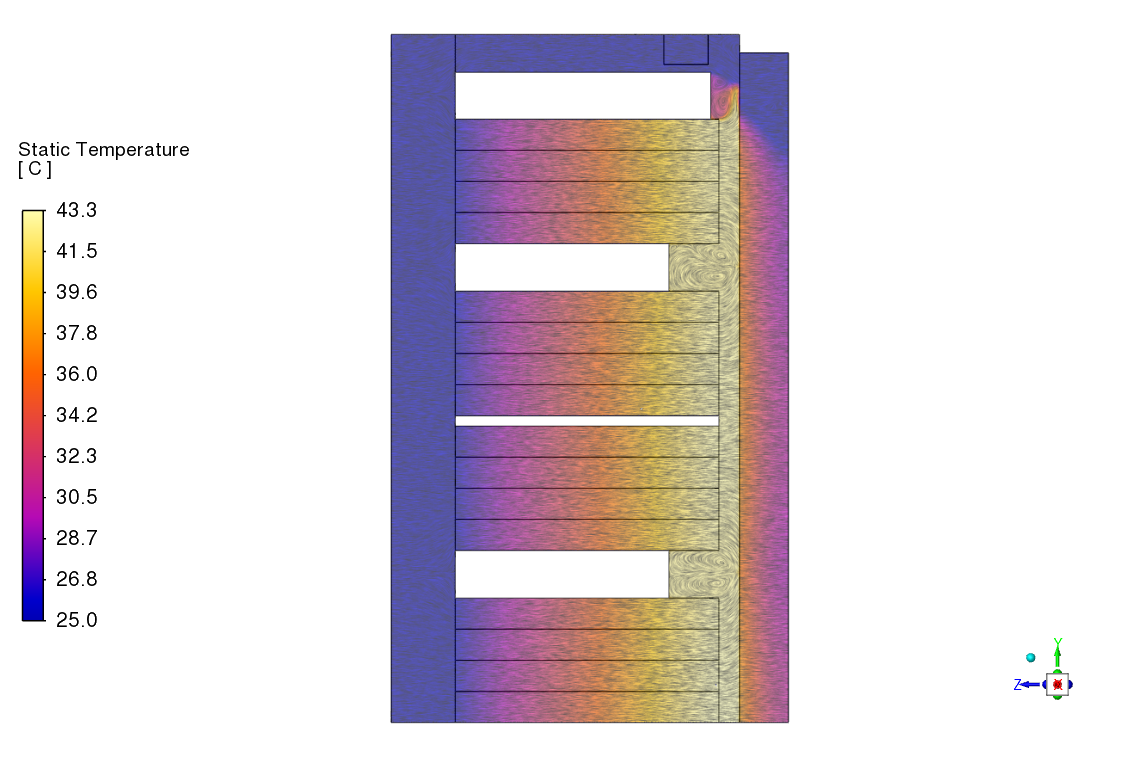
(c) Sub-scenario 3
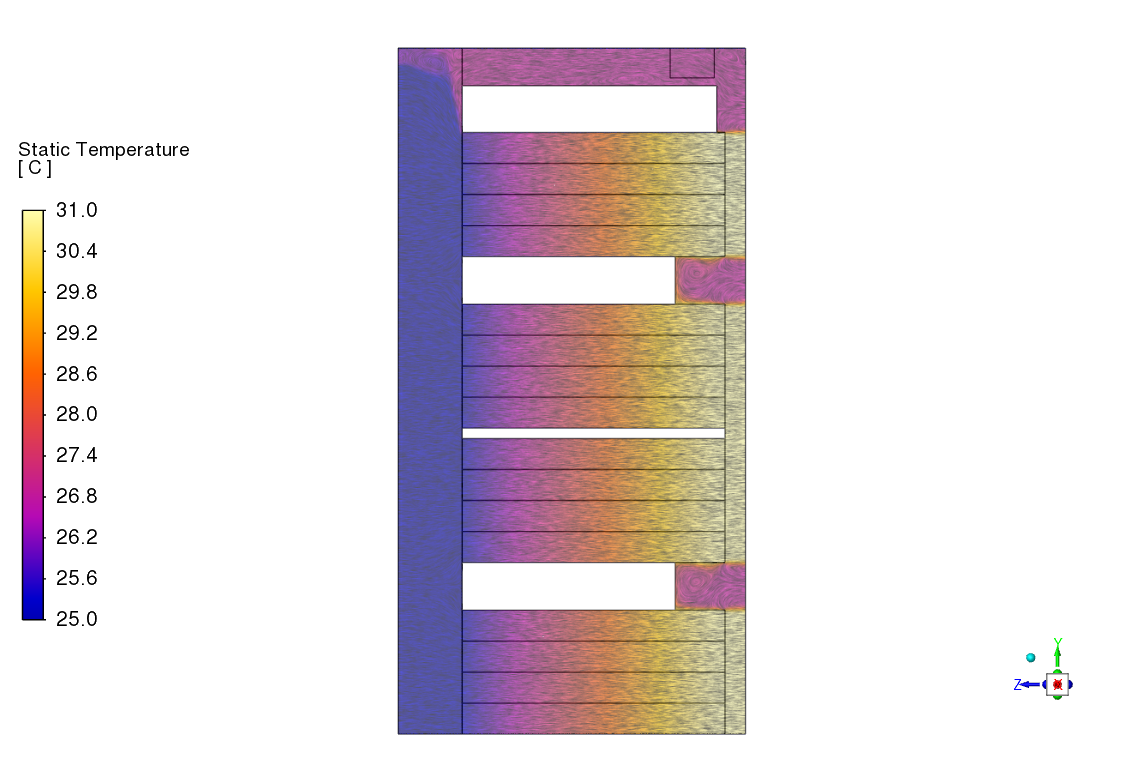
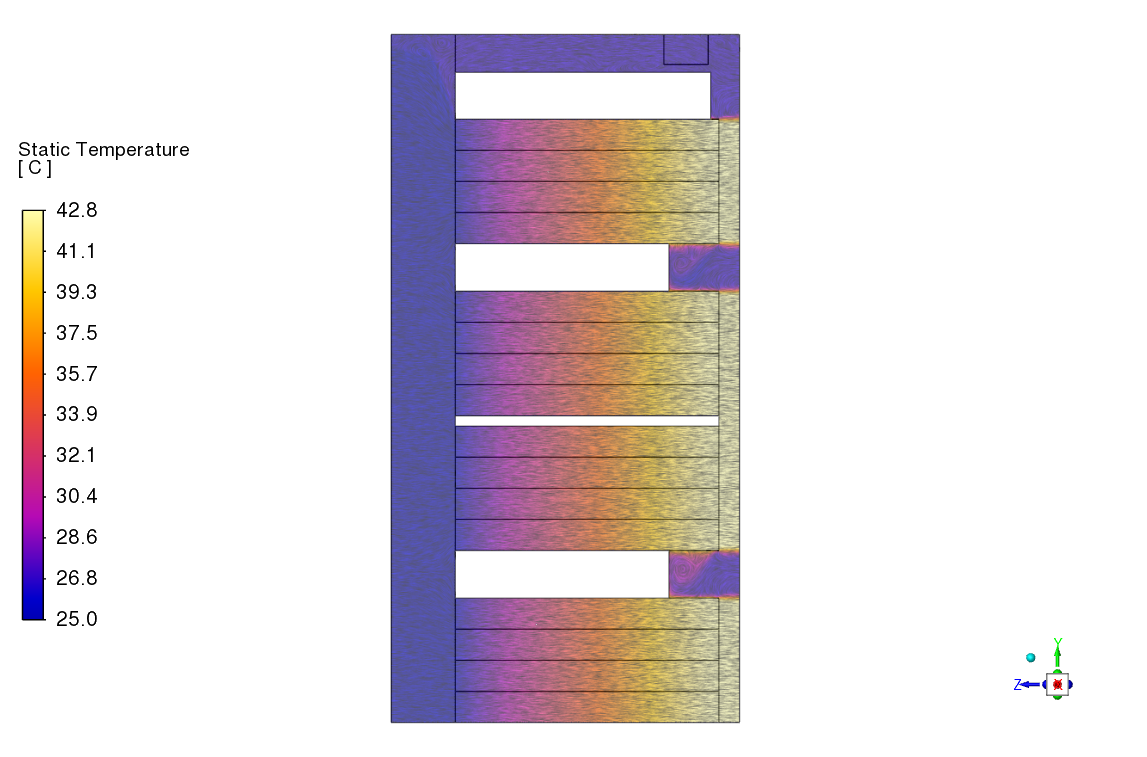
Figure 7 Temperature LIC plots in the middle of the rack at each sub-scenario.
The line integral convolution (LIC) plots of Figure 7 shows how the air temperature changes inside the rack. All three sub-scenarios show how the temperature gradually increases after passing through each individual rows. The LIC plot for sub-scenario 3 also shows how the rear door heat exchanger significantly cools down the air before the flow returns to the hot aisle.
The averaged exhaust air temperatures to be returned to the hot aisle can be directly compared between the sub-scenarios as shown in Table 1.
Table 1 Averaged exhaust temperatures and mass flow rates

Here, without the RDHx installed, the exhaust temperature out of the rack experience a rise of 11.5 °C after the thermal load is increased. On the other hand, the installed RDHx can massively reduce the exhaust temperature to a point lower than the original design at 10 kW. However, it is important to note that the internal temperature increase at each row is relatively unchanged before and after the installation. The RDHx exhaust fan also increases the total mass flow rate but that is due to the flow bypass occurring through the empty space.
External Flow for hot aisle containment system
Moving on to the three external flow scenarios, the CFD models are built following the layout shown in Figure 2 and Figure 3. Data from Table 1 are used to map the temperature differences between the intakes and exhausts of all 10 racks, avoiding the computing cost of explicitly modelling the internal intricacy at the length scale of the data centre. The mass flow rates of the racks are also prescribed based on their corresponding configuration, with the main cold air inlets and hot air outlets prescribed to provide enough air to each rack. The walls between the hot aisle, ductwork, and the main room are assumed to be perfectly insulated, preventing any thermal leakage between the cold and hot air streams.
A combined visualisation of the temperature variation along the data centre airflow is shown through Figure 8 and Figure 9. All three scenarios show a constant operating temperature of the cold air plenum at 25 °C, highlighting a perfect insulation between the cold air and hot air streams. For the original condition (Scenario 1), the hot aisle sits at a constant temperature of 30.8 °C because all 10 server racks operate with the original 10 kW heat load. As the left row of racks transitions to 30 kW, two distinct temperature streams are observed as the exhaust flows proceed from both sides and mix together in the middle of the hot aisle.
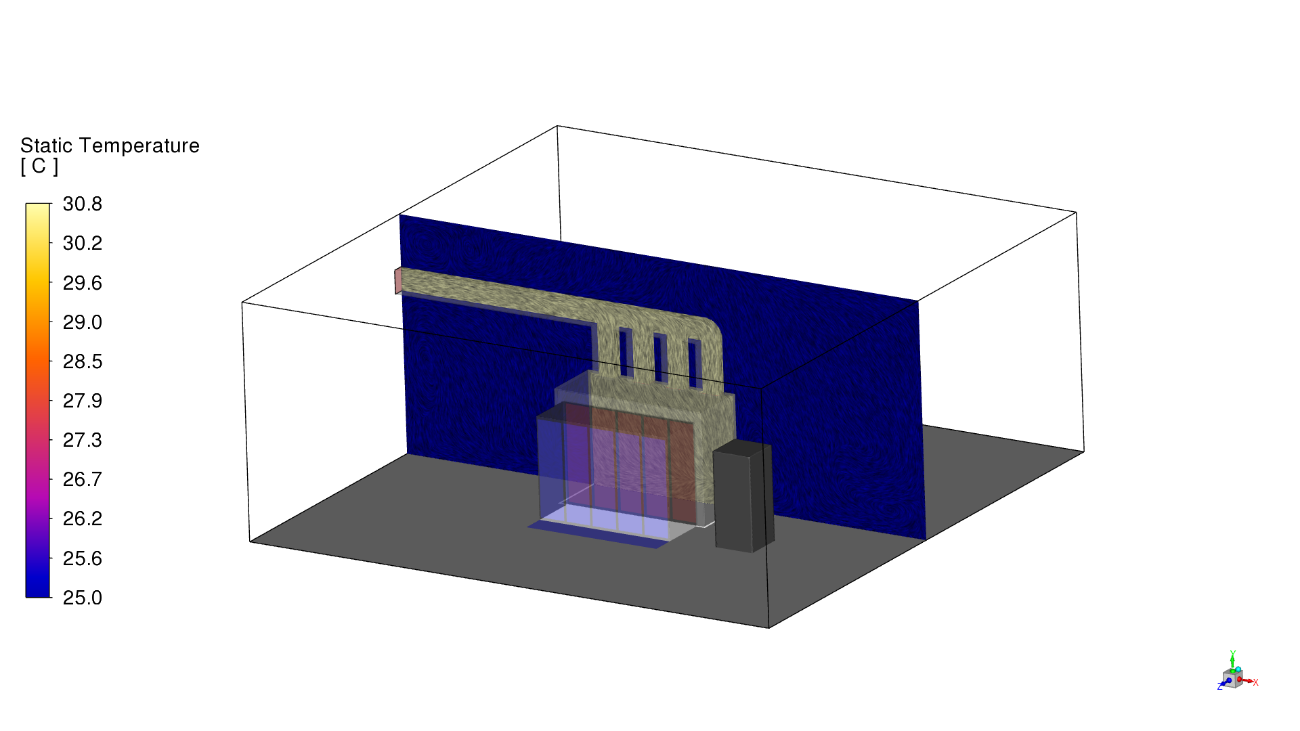
(a) Scenario 1
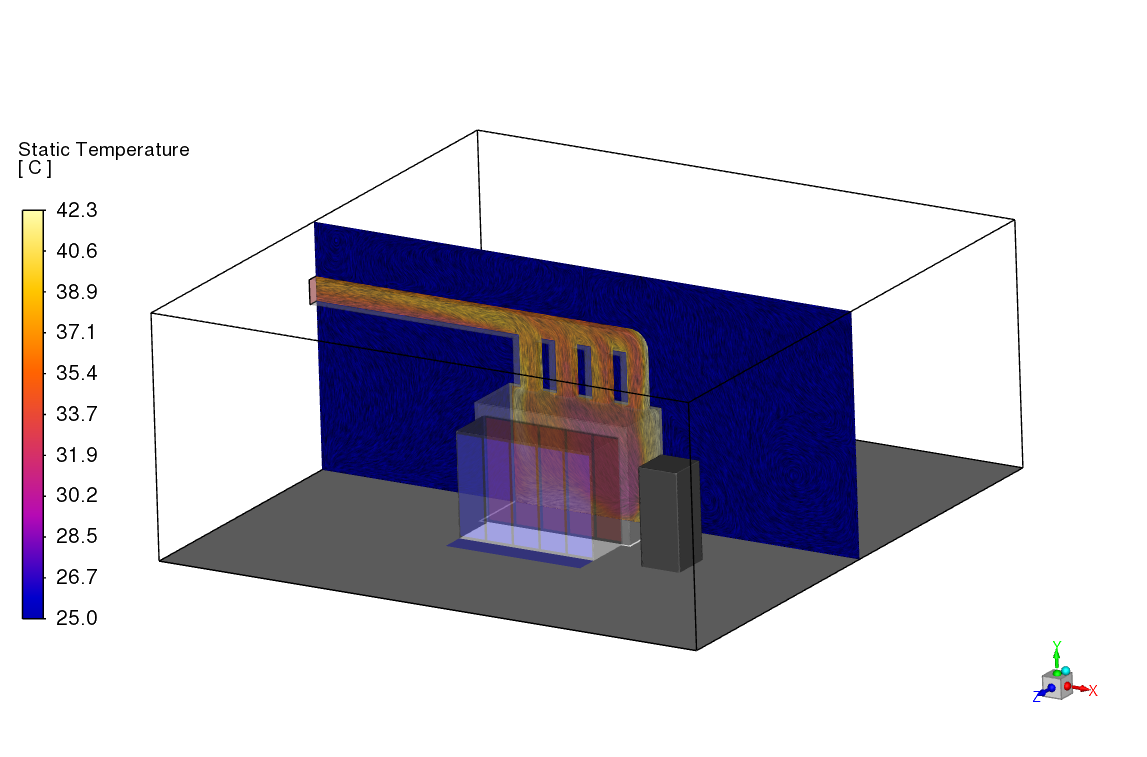
(b) Scenario 2
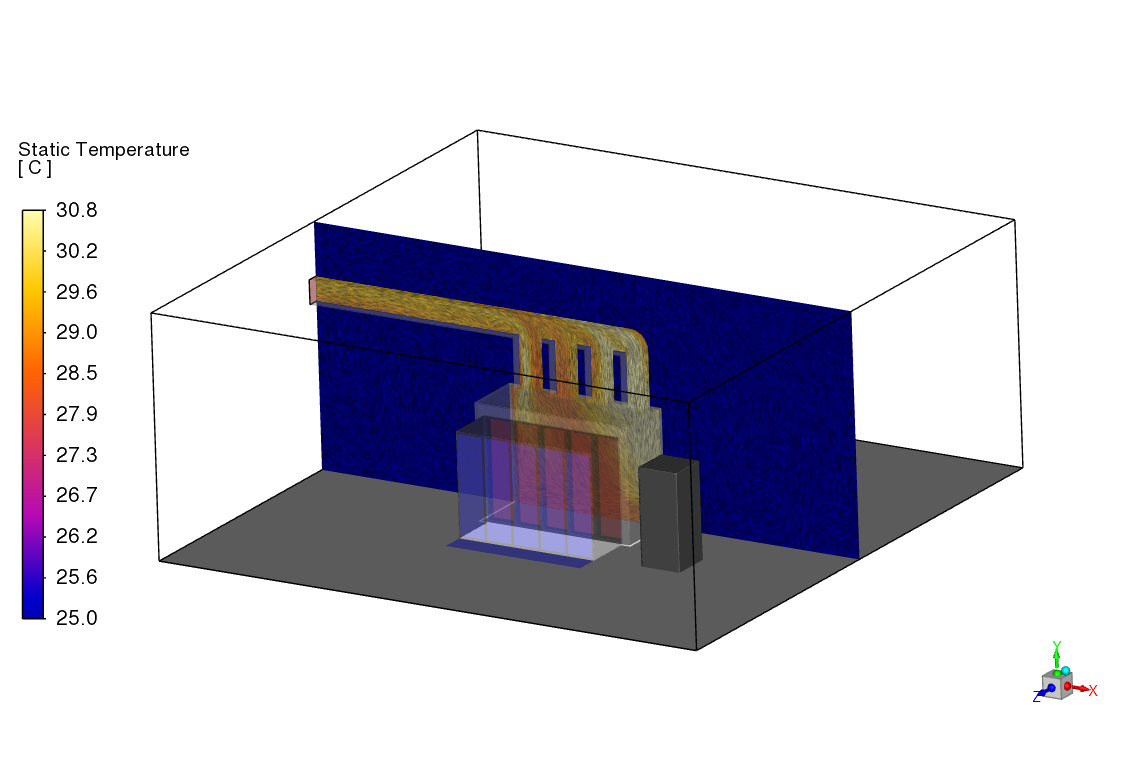
(c) Scenario 3
Figure 8 Temperature LIC plots for the data centre airflow along the hot aisle.
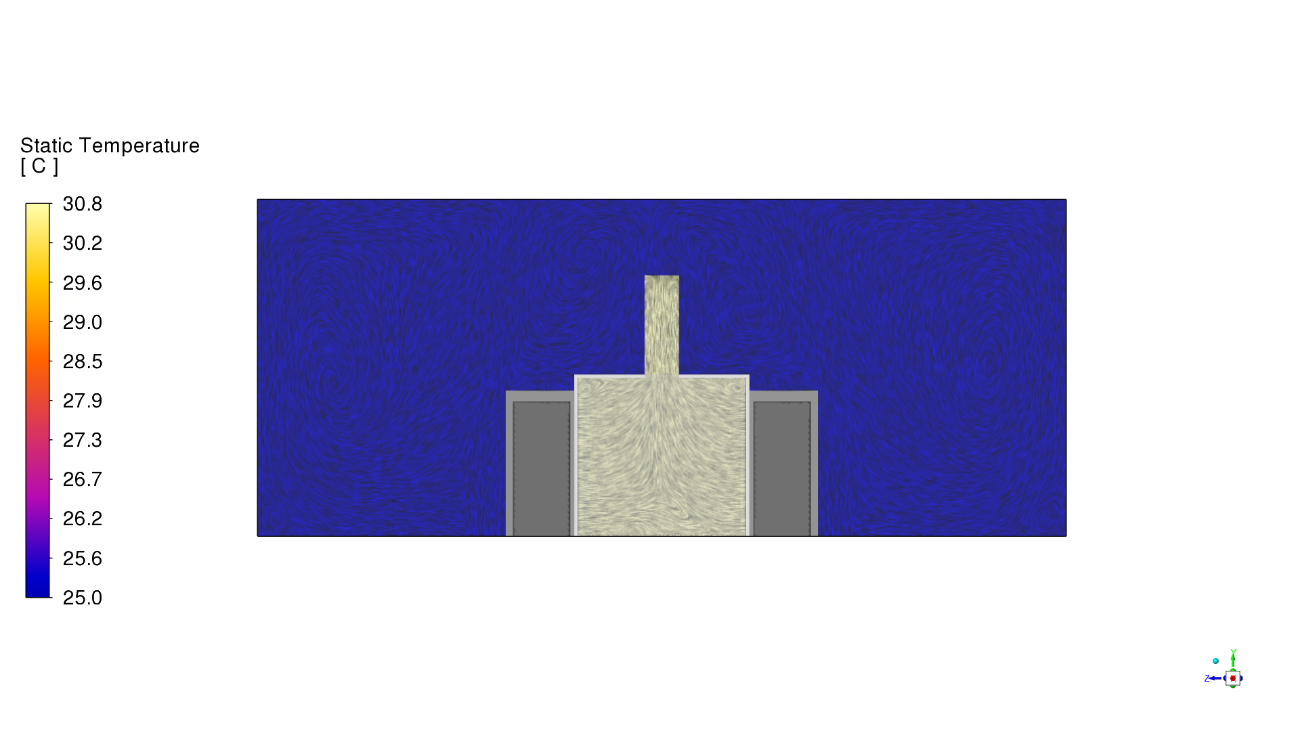
(a) Scenario 1
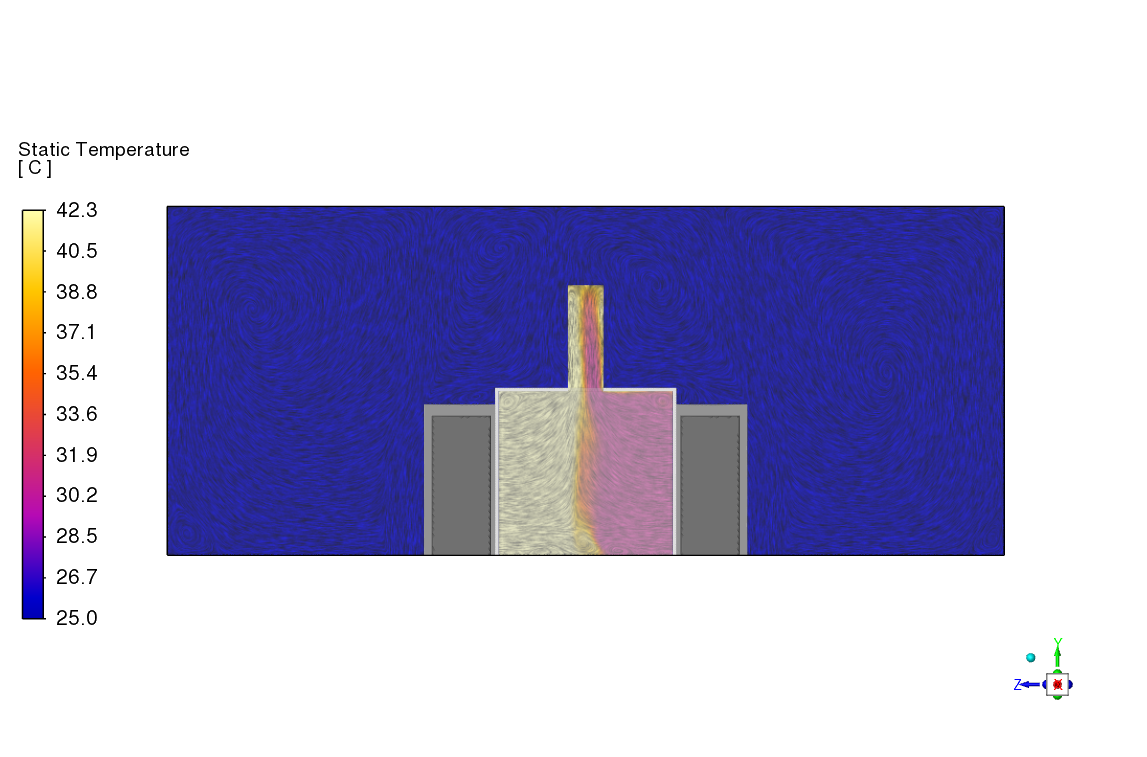
(b) Scenario 2
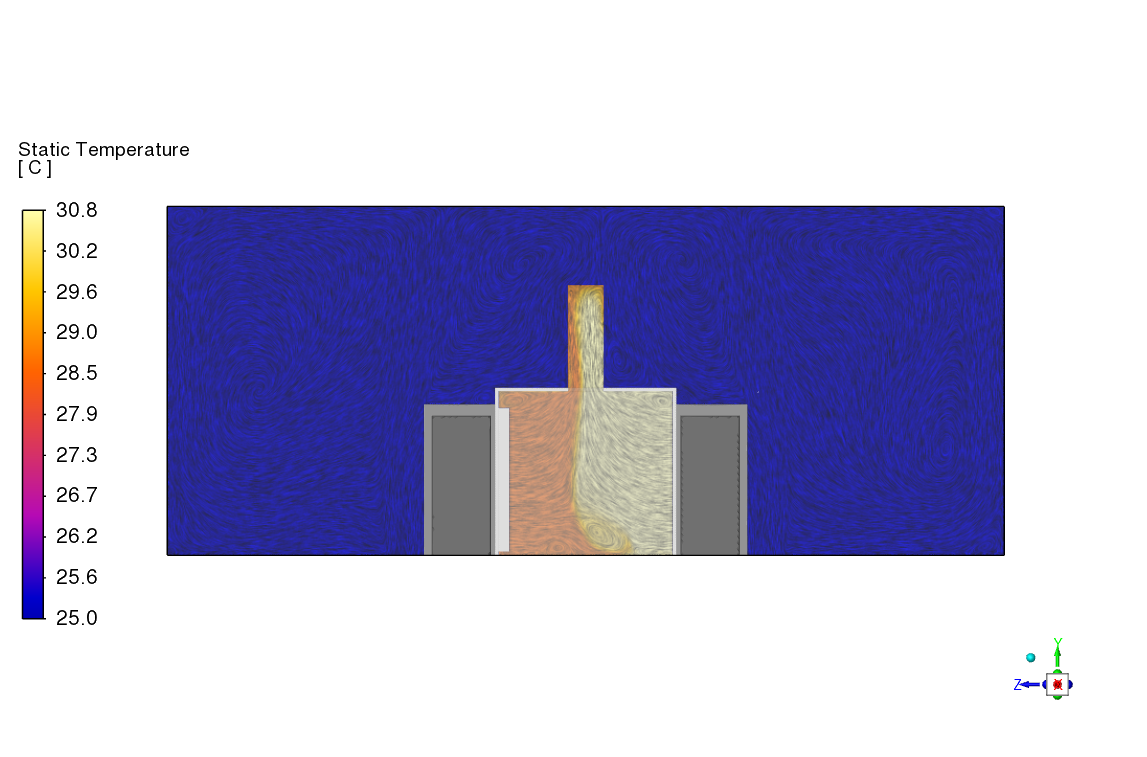
(c) Scenario 3
Figure 9 Temperature LIC plots for the data centre airflow across the racks at the back of the room.
From here, the cooling load exerted onto the main air-conditioning system can be quantified by a direct comparison of the average temperatures at the hot air outlet. Another quantitative metric of comparison is to calculate the amount of heat the air-conditioning system needs to remove (cooling capacity) to return the air temperature back to the desirable cold room temperature of 25 °C. These metrics are summarised in Table 2 for the three scenarios considered:
- Scenario 1: Baseline – original 10 kW heat load without RDHx installed
- Scenario 2: Increased 30 kW heat load from GPUs, without RDHx installed
- Scenario 3: Increased 30 kW heat load from GPUs, with RDHx installed
Table 2 Average hot air outlet temperature and required cooling capacity to return air to 25 °C

As can be seen from the table, the original data centre configuration would experience a major 97% increase in cooling load once half of the racks experience the rise in power consumption from GPU usage. Retrofitting the rear door heat exchangers to the left racks significantly alleviates the load on the main air-conditioning system.
Conclusion
Through this case study, Ansys Fluent’s CFD simulations have been used to analyse the effectiveness of a rear door heat exchanger (RDHx) hybrid cooling system for an existing air-cooled data centre. The CFD results show that the use of a RDHx system can provide a significant benefit in alleviating the cooling load on the existing air-conditioning system, whilst maintaining the threshold of maximum temperatures experienced by internal components inside each server rack.
References
[1] ASHRAE Technical Committee 9.9, “Emergence and Expansion of Liquid Cooling in Mainstream Data Centers,” ASHRAE, Atlanta, GA, 2019.
[2] I. Meta Platforms, “Specification for Open Rack V2,” 09 July 2015. [Online]. Available: https://www.opencompute.org/documents/open-rack-v2-specification-rev12-pdf/.
[3] P. Lin, V. Avelar and J. Niemann, “Implementing Hot and Cold Air Containment in Existing Data Centers,” Schneider Electric, 2013.